ADMX
ADMX, Asset Data Management eXtractionADMX, Asset Data Management eXtraction
ADMX · Asset Data Management eXtraction

The operating-system layer for municipal water.

From the meter to the customer. Connected systems. Smarter decisions.

ADMX sits on top of the AMI, billing and ERP systems you already run. It catches exceptions 30 days before the bill read, protects the life of your meters, and helps you keep the return you planned for.

Your data stays in your systemsRead-only connectionForward-deployed engineers
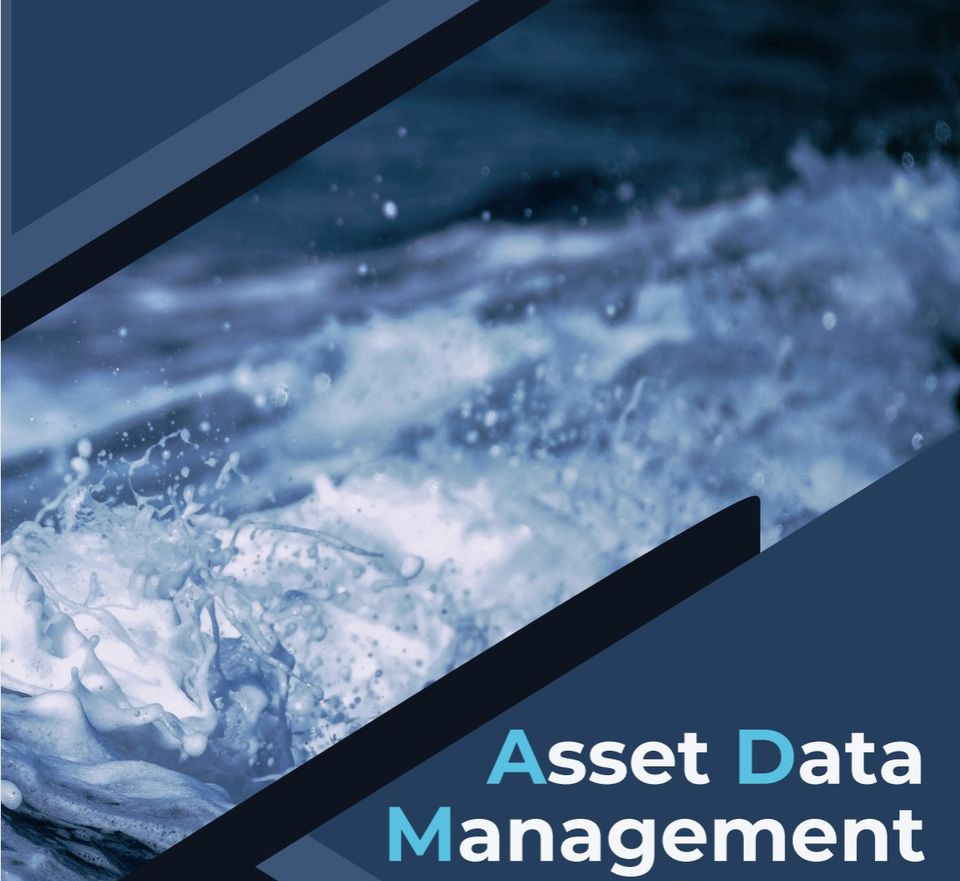
Water surging and spraying white over a dark current
Daily Exception ReportMON 06:00
EP 51207 · battery drainSchedule
R15-0417 · UID not linkedFix UID
R17-0093 · overnight flowCrew set
Works alongside the systems you run
  • AMI
  • Head end
  • MDMS
  • CIS
  • GIS
  • CMMS
  • ERP
  • SCADA
  • Inventory
The challenge

When you're estimating, you can't tell a billing error from a leak.

You bought smart meters, but you didn't get a smart system. Municipalities invest in AMI to find leaks, track non-revenue water and justify the loans behind their capital projects. But most AMI systems are built around the meter, not the operator. Why water is different.

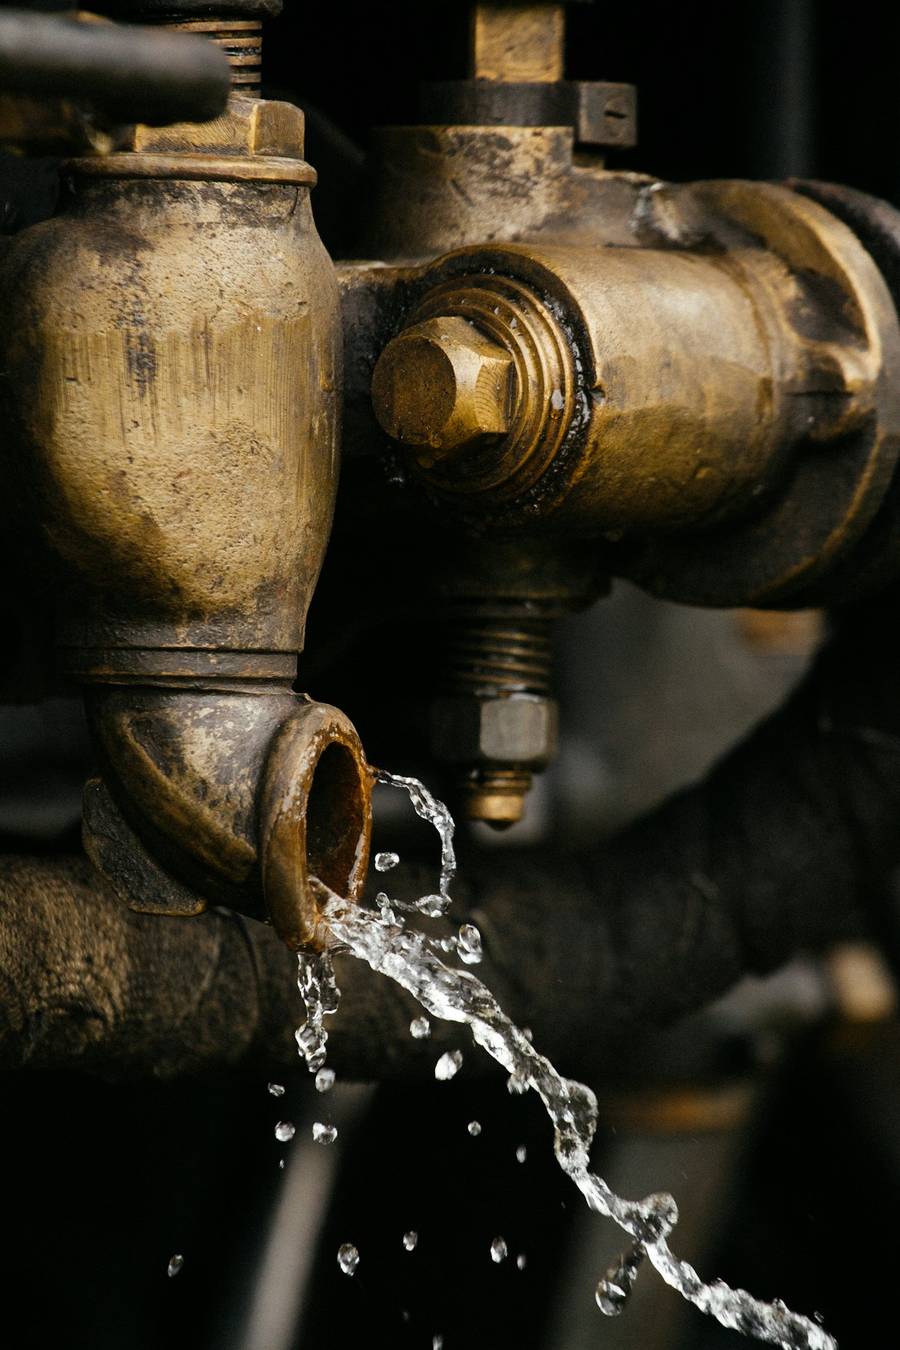
Water spraying from a leaking brass fitting
A billing error or a leak? Without operational data, they look the same.
Timing

Still waiting for the bill read

You have 24/7 reads, but you still wait a month to learn the health of your system.

Billing

Exceptions found on bill day

Problems surface when the bill read runs, so the corrected bill goes out four to five days late.

Accuracy

Small errors, wrong bills

Even a few percent of uncaught anomalies can skew billing estimates, so customers end up over- or undercharged.

Visibility

Meter-focused, not operator-focused

You can see one meter at a time. You can't see your whole system.

Data

Locked in data jail

Manufacturers kept your operational data behind an upsell. It's your data, and you already paid for it.

Assets

Systems dying early

A 15-year system can fail in five when it's configured wrong or changed by its manufacturer.

What 55 utilities told the Water Research Foundation
53 of 55named customer service and billing as the business unit most affected by smart metering.
31 of 55ranked IT and OT integration among their top three AMI project risks.
35 of 55put data integration and digital transformation in their top three procurement considerations.

Source: WRF Smart Metering Playbook, Survey Data (Project 5261). See what it means for your system.

Proactive operations

Catch it 30 days before the bill run, not on bill day.

Most billing departments pull meter reads once a month, one billing route at a time. ADMX uses the 24/7 data in between, so your team can check a whole route before the bill read ever runs.

Illustration of one billing cycle. Timing shown is typical, not a specific utility.

From alarm to resolution

One broken meter. Thirteen steps. One connected record.

From the first AMI alarm to the final management report, the same unique ID follows the meter through GIS, CIS, work orders, inventory, the field and billing.

  1. 1AMI alarm
  2. 2Unique ID
  3. 3GIS
  4. 4CIS
  5. 5Analytics
  6. 6Work order
  7. 7Reserve parts
  8. 8Warehouse
  9. 9Install
  10. 10Return (RMA)
  11. 11Validate
  12. 12Bill
  13. 13Verify
Outcomes

Keep the return you planned for. Then find what you've been leaving on the table.

“I might be able to have a lunch and make it home for dinner with my wife.”

An operator, when Jane Story asked what a daily exception report would do for him
  • Bills on time. No four-to-five day delays from improper reads.
  • Fair bills. Estimates corrected, so customers aren't over- or undercharged.
  • Fewer emergency truck rolls. Crews work planned routes instead of chasing problems.
  • Longer asset life. The design life you specified, not a fraction of it, from your meters and endpoints.
  • Water loss you can see. Non-revenue water tracked across the system, not just at one meter.
  • Defensible capital plans. Evidence to justify the loans and projects behind your AMI.
  • Faster reporting, lower cloud costs. No 24-hour reports and no paying to store data you'll never use.
  • Each outcome is measured in your pilot against a baseline you agree to first. See how we measure value.
The key takeaway

Connected systems need two things. ADMX brings both.

API = how systems communicate.

Secure, read-only connections move the data so nobody has to re-key it.

UID = how they know what they're talking about.

One master record links every system's own ID for the same meter, customer, place or asset.

Together they let your stakeholders connect their systems, work more efficiently, reduce costs and serve customers better: bills on time, fewer truck rolls and asset history that is never lost.

See how APIs and UIDs work together

How ADMX is delivered

One team. One cohesive view. One simple price.

Forward-deployed engineers

Onboard the platform

ADMX employees onboard our proprietary platform onto your existing AMI infrastructure, creating one cohesive view of the systems you already run.

Data scientists & account managers

Keep the data right

Data scientists and a designated change-management account manager ensure data integrity, from the meter to the bill, as your people and processes change.

Fixed fee + per meter

Pay simply

A fixed-fee activation, then a monthly subscription per meter, per month, for the deployment and continued operation of the live system.

Meet the delivery team · See the subscription model

For primes and engineering firms

Installing or bidding smart meters? Team with the data-integrity partner.

ADMX helps your team prove read rates and acceptance, trace every failure to its source, and leave the owner supported after handover. Explore published AMI contracts and open pursuits in the Opportunity Atlas.

$1.12BAMI contract values, continental U.S.
$509Min Texas
Why primes team with ADMXOpen the Opportunity Atlas
Start here

See what three years of your own data is telling you.

We run three years of your meter data against local weather to see whether your system follows its environment. If anomalous data has crept in, the skew shows, and we show you how to correct your billing estimates.

  1. Your consumption trend against local weather
  2. Signs of skew or anomalous data, and when it started
  3. Your real peak months against your rate study
  4. Recommended billing-estimate corrections
  5. A first look at untapped pressure and flow data, where your head-end exposes it
Integrate. Automate. Optimize.People · Data · Infrastructure · Stronger communities